Returns are usually the part of ecommerce no one wants to talk about. They show up as red numbers on a dashboard – refunds processed, revenue gone, customers slipping away. The instinct is to minimize them, hide them, or absorb them as a cost of doing business online.
April 2026 told a different story.
Across every Shopify store using Synctrack Returns & Exchanges last month, returns didn’t just happen – they converted. Customers who would have walked away with a refund instead walked away with a different size, a store credit, an upgraded product, or a gift card sitting in their account waiting to be spent. The total revenue that stayed in merchants’ businesses was significant enough to change how we think about what returns actually are.
$350,842 retained from a $2.25M return pool
In April 2026, Synctrack processed 11,833 return requests covering 21,397 returned items, representing $2,257,833.47 in total return value.
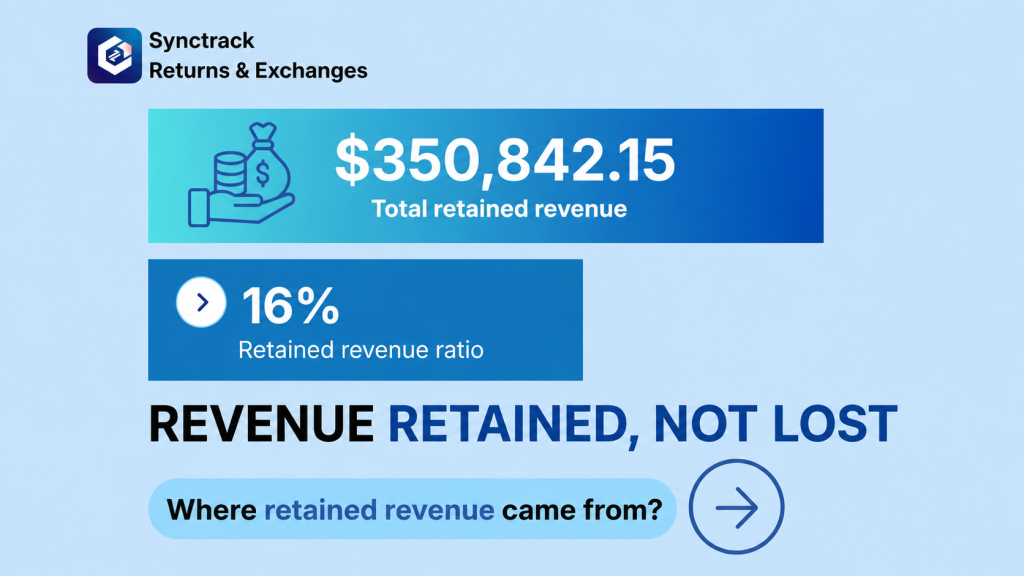
Of that, $350,842.15 stayed inside merchant businesses – recovered through exchanges, store credit, gift cards, and discount codes instead of leaving as cash refunds.
That’s a 16% retained revenue ratio. For every $100 a customer requested back, $16 stayed with the merchant in some form.
In aggregate, that’s a third of a million dollars that would have been a refund line item – now sitting on merchant balance sheets as recovered revenue, future store credit redemptions, or completed exchange orders already shipped.
What The Return Rates Actually Mean
Two numbers tell the underlying story of return health:
- Order return rate: 1.79% – out of every 100 orders, fewer than 2 resulted in a return request
- Item return rate: 0.50% – out of every 200 items shipped, only 1 came back
Both are healthy benchmarks for the broader DTC ecommerce category, where return rates often climb to 8–10% (and 20–30% in apparel). The merchants in Synctrack’s network are running tighter return operations than the industry average – which means the $350K retained came from a relatively small return pool, not from being buried in returns.
The takeaway: retention strategy works at any scale. You don’t need a return crisis to recover meaningful revenue.
Exchange Was the Biggest Revenue Saver
Of the four retention paths, exchange did the heaviest lifting by a wide margin.
| Retention path |
April 2026 revenue retained |
Share of retained revenue |
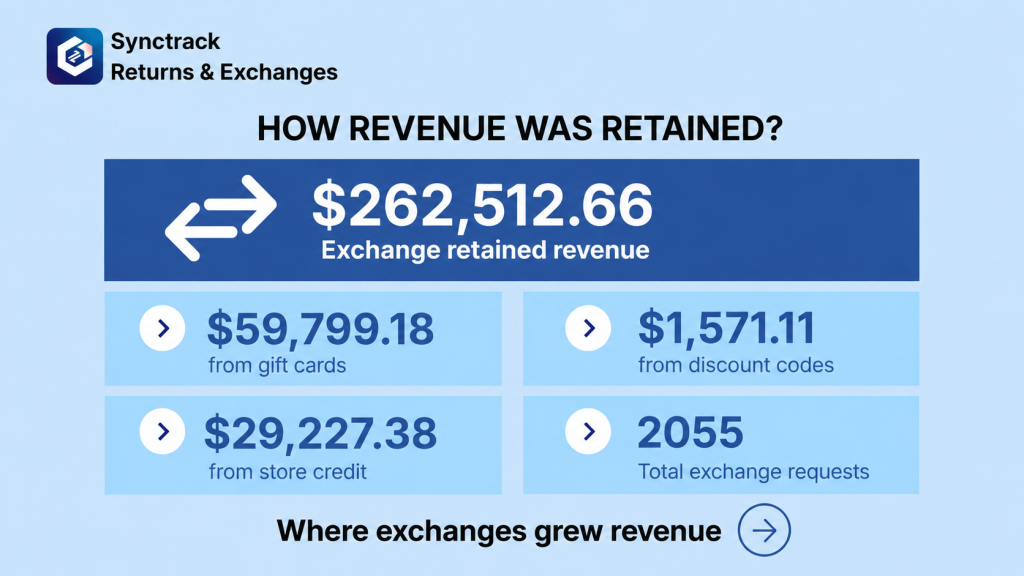
| Exchanges |
$262,512.66 |
74.8% |
| Gift cards |
$59,799.18 |
17.0% |
| Store credit |
$29,227.38 |
8.3% |
| Discount codes |
$1,571.11 |
0.4% |
Merchants processed 2,055 exchange requests in April, with an overall exchange rate of 17% – meaning roughly 1 in every 6 return requests was redirected from a refund into an exchange.
That conversion rate is the entire ballgame. A refund is a closed door. An exchange keeps the customer in the product, in the brand, and in the relationship. The 17% who exchanged instead of refunded represent customers who didn’t leave – they just adjusted.
The Upsell Exchange Story: 419 Customers Paid More On The Way Back
This is the metric most merchants don’t realize is possible.
When a customer initiates an exchange, they’re not always swapping for the same-priced item. Sometimes they upgrade – a larger size with a higher price point, a different model, a premium variant. When that happens, the customer pays the difference at checkout.
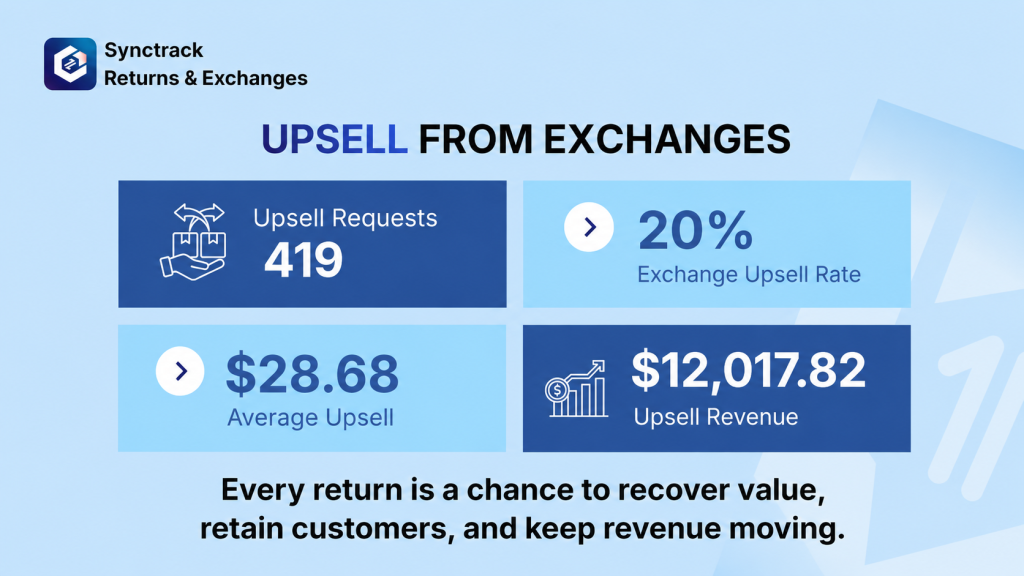
In April 2026, 419 exchange requests resulted in upsells – meaning customers who came in to return something ended up paying more than their original order.
The numbers:
- 20% exchange upsell rate – 1 in 5 exchange requests generated additional revenue
- $12,017.82 total exchange upsell revenue added on top of retained revenue
- $28.68 average upsell per request
$28.68 is roughly the cost of acquiring one new email subscriber through paid social. Synctrack merchants generated that value 419 times in a single month – from customers who originally wanted a refund.
Why This Matters for How Merchants Think About Returns
The conventional return mindset goes something like this: “Returns are bad. Reduce them. The customers who return aren’t worth chasing.”
The customers who returned in April were already engaged. They’d ordered, opened, tried on, evaluated. They had a clear opinion about what they wanted – they just wanted something different from what they got. That intent doesn’t disappear when a return request gets filed. What disappears is the merchant’s chance to capture it, if the only option offered is a refund.
Three things stood out from our April numbers:
1. Most retained revenue comes from one path.
Exchanges drove almost three-quarters of all revenue retained. Merchants who haven’t built a smooth exchange flow are leaving the largest lever untouched.
2. Gift cards punch above their weight.
$59,799 retained through gift cards is impressive given that gift cards are usually presented as a fallback option. They sit on customer accounts, get redeemed later, and often get spent on more than their face value.
3. Upsell exchanges are not edge cases.
1 in 5 exchanges generated upsell revenue. That’s not a quirky outlier – that’s a systematic pattern that compounds when surfaced consistently in the return flow.
The Bigger Pattern
Returns will always happen. The question is what happens during the return that decides whether revenue leaves the business or stays in it.
Our April 2026 showed that with the right flow, 16% of every dollar requested back can stay in the business, and 20% of exchange requests can generate additional revenue on top of that.
Returns aren’t the end of the customer journey. April proved they can be the start of the next one.