Most Shopify merchants check their sales dashboard every morning. Few track the numbers that decide whether those sales turn into repeat customers or angry “Where is my order?” emails. That gap is where Fulfillment KPIs come in.
Fulfillment KPIs show how well your shop turns a paid order into a delivered package, covering pack time, carrier pickup, tracking quality, and exception rates. Ignore them, and complaints grow, refund requests pile up, and ad spend stops paying off because new customers don’t come back. This guide covers the Fulfillment KPIs that matter, how to set them up with Shopify data, and how to turn each one into a real decision for your shop.
Contents
Shopify is great at telling you what you sold. It is less direct about telling you whether your shop kept the promise that came with the sale. A two-day delivery banner on the product page does nothing for trust if real orders take six.
Three things break when fulfillment is weak:
The fix is not “ship faster.” The fix is to know exactly where time is being lost, which carriers are slowing things down, which destinations are slipping, and which products keep coming back. That is what a good set of Fulfillment KPIs tells you.
The list below is the short version. Each KPI is followed by a clear definition, the Shopify data behind it, and what to do when the number looks bad.
| Metric | What It Measures | Good Target | Where to Look in Shopify |
| Order Volume | Orders created in the period | Compare year over year | Orders over time report |
| Fulfillment Rate | Fulfilled ÷ shippable orders | Close to 100% | Order fulfillment status |
| Processing Time | Order placed → fulfilled | Under 24 hours | Shipping and delivery performance |
| Dispatch Lead Time | Fulfilled → carrier in transit | Under 24 hours | Fulfillment events |
| Shipping Time | In transit → delivered | Carrier and lane dependent | Shipping and delivery performance |
| Order-to-Delivery Time | Order placed → delivered | Match the product page promise | Shipping and delivery performance |
| Tracked Shipments | Share with valid tracking | Over 95% | Fulfillment tracking fields |
| Exception Rate | Exceptions ÷ shipments | Under 3% | Fulfillment events |
| Return Rate | Returned items ÷ ordered items | Category dependent | Orders and reversals by product |
| SKU Performance | KPIs cut by product | Per-SKU watch list | Line item and variant data |
| Cohort Retention | Repeat behavior by first-order group | Stable or rising | Customer cohort analysis report |
This is the count of orders created in a chosen period. It looks basic, but it sets the context for every other metric. A 20% jump in order volume can hide a 10% drop in on-time delivery, because the same warehouse team is now packing more boxes per hour.
Where to find it in Shopify: the Orders over time report inside Shopify Analytics. Pull it weekly and compare it to the same week last year, not just last week.
Action: When you see a volume spike coming, talk to your warehouse or 3PL before it happens. Shopify itself recommends demand forecasting so merchants can prepare staffing and inventory for promotions and seasonal periods.
Fulfillment rate is the share of shippable orders that actually got fulfilled in the period. The simple formula is:
| Fulfillment Rate = (Fulfilled Orders ÷ Total Shippable Orders) × 100 |
According to Shopify’s official fulfillment guides, fill rates ‘tend to range from 85% to 95% or higher,’ with 90% a reasonable goal; a separate order-accuracy benchmark sits at 96 – 98%. So a healthy shop sits close to 100%. Anything lower means orders are stuck in “unfulfilled” or “partially fulfilled” status. That is usually a stock issue, a workflow issue, or a sync issue between Shopify and the warehouse system.
Action: if your fulfillment rate drops, sort unfulfilled orders by age. Anything older than two days needs a reason: backorder, address problem, fraud check, or stuck integration. Fix the oldest ones first.
Processing time is the gap between an order being placed and the moment it is marked as fulfilled. It is the part of the journey your team fully controls.
A common benchmark is “same day if ordered before 2 PM, next day otherwise.” If your real numbers do not match the promise on your product page, your delivery date is already lying to customers before the carrier even shows up.
Action: if the average processing time is creeping up, look at three things first. Pick-and-pack staffing, the cutoff time on your shipping rules, and the print-label-to-handoff step. The Synctrack dashboard surfaces this view as part of its Fulfillment Performance tab so you can see the trend instead of guessing.
This one gets missed often. Dispatch lead time is the gap between an order being marked as fulfilled and the carrier actually scanning it as “in transit.” A short processing time means nothing if boxes sit on the loading dock for two days waiting for pickup.
Action: If the dispatch lead time is high, your team is probably marking orders as fulfilled before the carrier handoff. Move the “fulfilled” trigger to the actual handoff, schedule earlier pickups, or switch to a carrier with more pickup frequency.
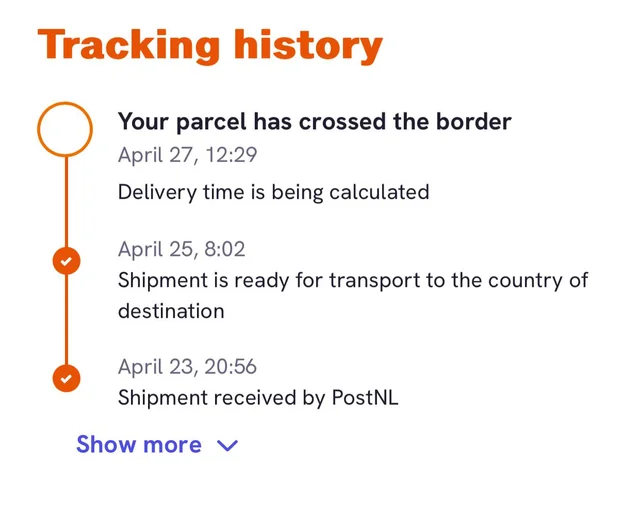 Shipping time is the transit-only number: how long it takes from carrier pickup to delivery at the customer’s door. This is where carrier choice, lane quality, and customs friction show up.
Track it by carrier and by destination. A flat average hides the truth. You may have a great average and a terrible Tuesday route to one specific region.
Action: if one carrier is consistently slow on one lane, switch carriers for that lane only. There is no reward for loyalty to a partner that is hurting your customer experience.
This is the full end-to-end number, from the moment the customer clicks “Buy” to the moment the parcel arrives. It is the only metric that matches the customer’s lived experience.
If your order-to-delivery time is 6.5 days and your product page promises 3 to 5 days, you have a credibility problem. The fix is either to ship faster or to change the promise.
Action: break the total time into the three stages above (processing, dispatch, shipping). Fix the slowest stage first instead of trying to compress all three at once.
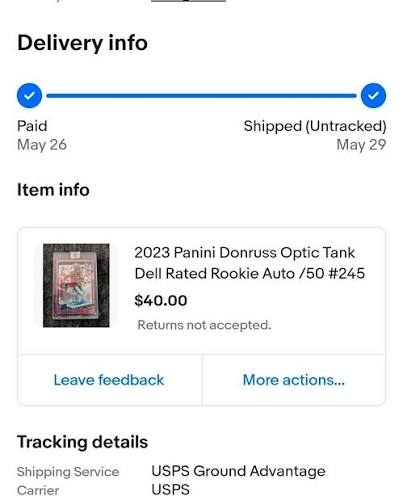
Every shipment needs a tracking number that syncs back to Shopify and to the customer’s inbox. When tracking is missing or unsupported, the customer is left guessing, and your support team gets flooded.
A healthy shop runs over 95% tracked. Across the e-commerce logistics sector, maintaining a tracking rate above 95% is the standard for operational health. For example, Amazon requires sellers to maintain a Valid Tracking Rate (VTR) of greater than 95% to keep their accounts in good standing. Similarly, the benchmark for general order tracking and perfect order fulfillment is established at 95%+ by supply chain experts. Anything lower points to a sync issue, an unsupported carrier, or a warehouse step that skips tracking upload.
Action: turn on auto-tracking sync, restrict the carriers your team can use to ones that report tracking events, and audit any shipment that went out without a number.
Exceptions are tracking events that signal something went wrong: failed delivery attempts, customs holds, address issues, and returns to sender. Expirations are shipments that stop updating before they are marked as delivered.
Both are early warning signs. A rising exception rate often shows up days before customers start complaining.
Action: Review exception reasons every week. Addressing issues means a checkout fix. Customs holds mean a documentation fix. Repeated failed delivery attempts mean a delivery instructions field or a carrier change.
Return rate is the share of shipped items that came back. Shopify reports it as returned items divided by ordered items, which is the right way to measure it. A single high-return SKU can pull the whole shop’s number up.
Action: look at returns by SKU, by vendor, and by reason. A spike on one product usually points to sizing, fragile packaging, or a product detail page that promises more than the product delivers.
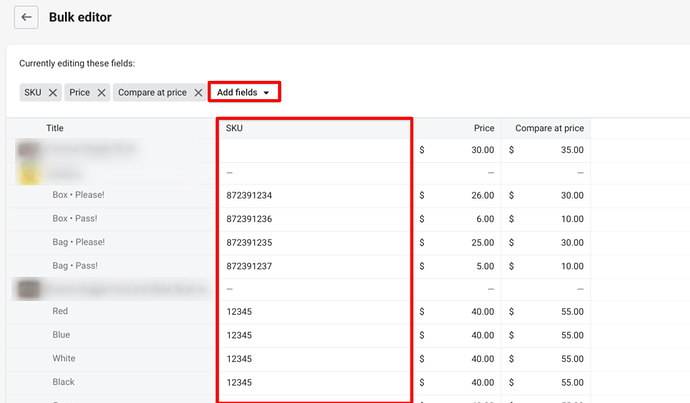
This is not one number, it is a way of cutting all the numbers above by product. Which SKUs ship fastest? Which gets returned the most? Which has the most exceptions? SKU-level data turns vague problems into specific fixes.
Action: keep a short list of “watch” SKUs every month. These are products with high return rates, high exception rates, or slow processing. Pull them into a weekly review until the numbers settle.
Cohort analysis groups customers by their first order date and tracks how they behave over time. For fulfillment, the question is simple: do customers whose first order shipped late come back less often?
Shopify offers a customer cohort analysis report inside its analytics. Pair it with delivery data to see whether late first orders kill repeat business. They usually do.
Action: for any cohort with a bad first-order experience, run a recovery campaign with an apology, a credit, or free shipping on the next order.
Knowing which Fulfillment KPIs to track is only half the battle. Actually tracking them inside Shopify is a logistical nightmare. To get a clear picture of your processing times, carrier delays, and tracking exceptions, you are forced to export massive CSV files, build complex pivot tables, and cross-reference data across multiple carrier platforms just to figure out what happened last week.
By the time you finally crunch the numbers and realize that 12% of your orders shipped without tracking, or that a specific carrier is stalling on dispatch, it’s already too late. Your inbox is already flooded with “Where is my order?” (WISMO) tickets, refund requests are piling up, and the bold “Fast 2-Day Shipping” promise you advertised on your storefront has actively damaged your brand’s trust. You are constantly fighting operational fires instead of preventing them, losing both time and repeat customers in the process.
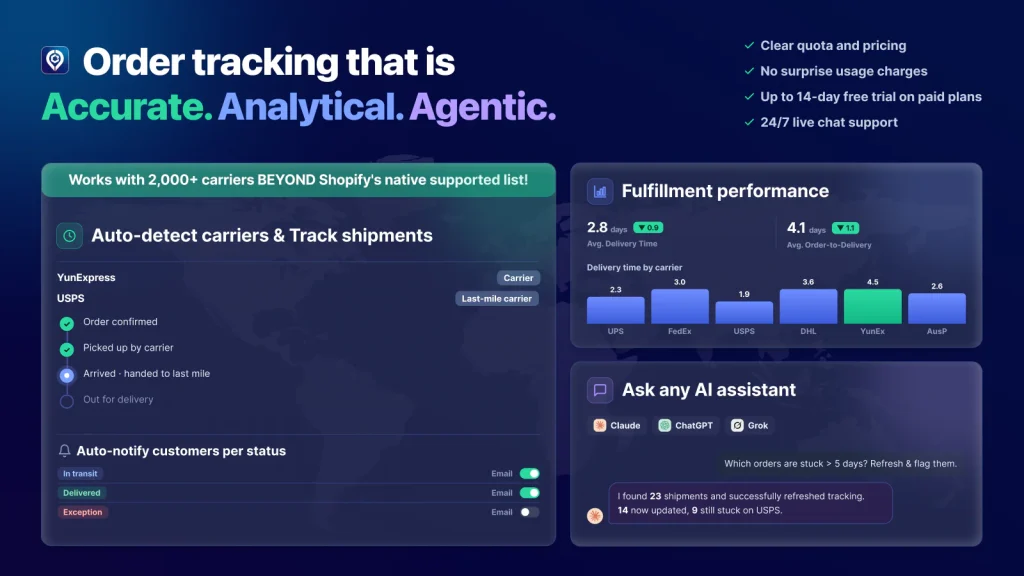
This is exactly why Shopify merchants use the Analytics Dashboard inside Synctrack Order Tracking.
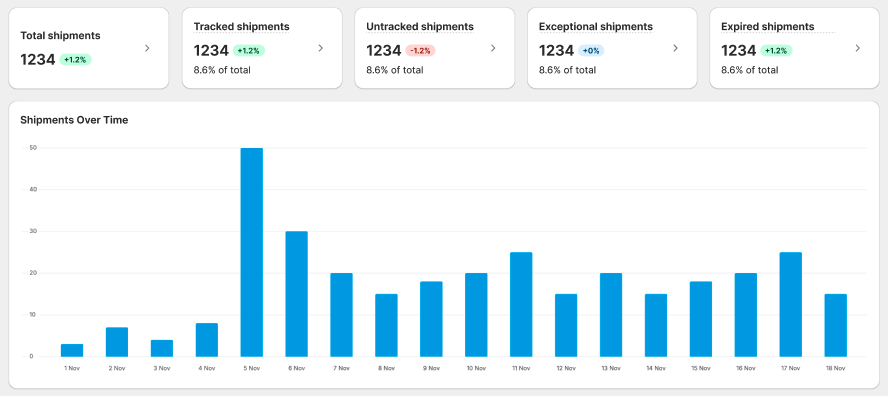
Instead of committing to a heavy, generic BI tool that takes weeks to configure, Synctrack provides a focused, workflow-first operations dashboard designed to answer two critical questions instantly:
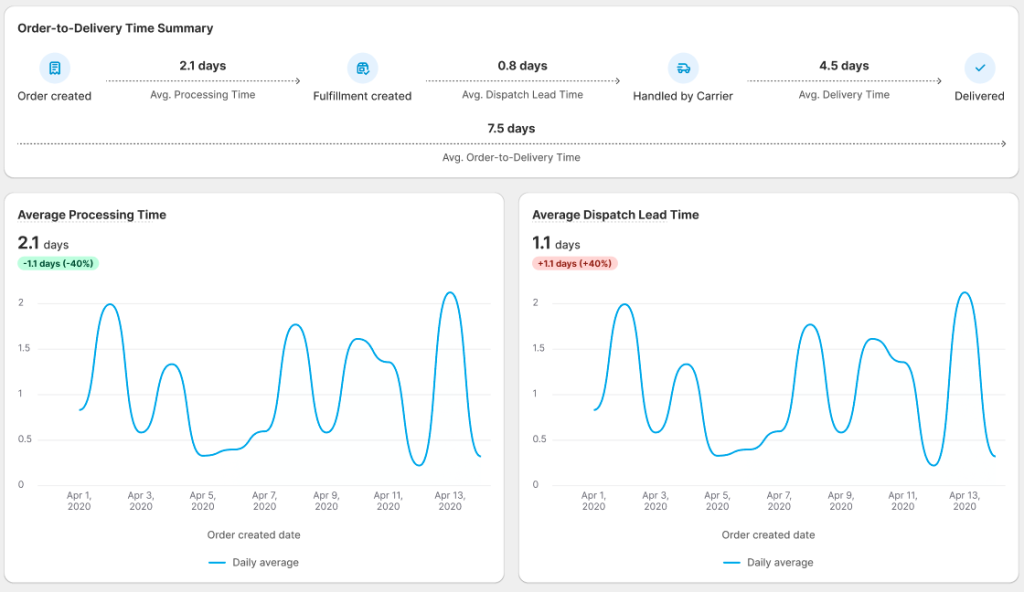
Pairing a highly optimized storefront with Synctrack’s operational visibility closes the loop between what your store promises and what your customer actually receives.
Processing time, dispatch lead time, shipping time, order-to-delivery time, and return rate are the core five. Add tracked shipment rate and exception rate if you want a complete operational picture.
Daily for tracked rate, exceptions, and dispatch lead time. Weekly for processing time, shipping time, and order-to-delivery. Monthly for return rate, SKU patterns, and cohort behavior.
Yes, for the basics. Shopify reports cover order volume, fulfillment status, time to fulfill, time to ship, time to deliver, and return rate. A dedicated app helps when you want carrier splits, destination breakdowns, and stage-by-stage views without building them yourself.
With Shopify’s native reports, a few hours. With an app like Synctrack, install time is minutes, and a useful baseline shows up after the first few days of data.
Final Thought
Fulfillment KPIs are the bridge between the sale and the customer experience. Sales reports show what you sold yesterday. Fulfillment KPIs show whether those customers will buy again. For Shopify merchants who want to grow without growing their support load, those numbers belong on the daily dashboard, not in a spreadsheet that nobody opens. With the right Fulfillment KPIs in place, the next “Where is my order?” Email is one you can answer before the customer even sends it.