Ask three people on your team how long it takes to fulfill an order, and you’ll probably get three different answers. Not because anyone’s wrong, but because “order cycle time” means something slightly different to each of them. One starts the clock at “buy.” Another starts it when the order hits the warehouse. One stops at shipment, another at delivery.
That mismatch causes more reporting headaches than almost any other supply chain metric. Below, you’ll find a clear definition, the formulas people actually use, real benchmarks, and the fixes that move the needle when your cycle time is dragging.
Order cycle time is the average time it takes to get a customer’s order from placed to delivered. Most teams measure it in order to doorstep, but the industry hasn’t agreed on exactly where “start” and “finish” sit, and that’s the real source of confusion.
A few common definitions:
Before you report a number, settle three things: When does the clock start? When does it stop? Does shipping time count? Write the answers down. It’s a small habit that prevents most of the arguments over whose number is “right.”
Quick example: two stores both claim a “two-day” cycle time. Store A measures order to ship. Store B measures order to delivery. Store B is actually far faster, but the headline number hides it.
These terms get used interchangeably, and most of the time that’s fine. But there’s a gap worth knowing about.
Order cycle time is the customer-facing version, starting when someone clicks “buy” and ending at the doorstep. Order fulfillment cycle time is the operational cousin, starting when your system receives the order internally and ending at customer acceptance.
Usually these clocks start within seconds of each other. But add a payment review or a backorder queue, and the gap between “order placed” and “order received by fulfillment” can stretch into hours or days. If you only track fulfillment cycle time, that gap quietly disappears from your reporting, even though the customer is still waiting.
The fix: pick one term for customer-facing promises, one for internal operations, and define both clearly.
This metric shapes how customers feel about your brand, whether they realize it or not. Fast, predictable orders build trust. Slow ones send shoppers to a competitor. For online stores, delivery speed has become part of the brand itself.
It also works as an early warning system. A creeping cycle time usually signals a stockout, a slow order check, or a shipping delay upstream, so you catch the weak link before customers start complaining.
It helps with planning, too. Know your real cycle time, and you can promise dates you can keep. That alone cuts down support tickets and refund requests.
There’s a money angle as well. Shorter cycles usually mean lower labor cost per order and fewer rush-shipping fees. And it keeps everyone honest: sales, operations, and support all look at the same clock, so nobody can point fingers when an order runs late.
| Average Order Cycle Time = Total order completion time ÷ Number of orders |
Subtract placement time from completion time for each order, add up the results, then divide by the number of orders. You’ll need clean timestamps for this to mean anything, so double-check your data first.
Five orders ship in a week, all in stock:
Total: 230 hours ÷ 5 orders = 46 hours, or roughly 1.9 days.
Some teams isolate warehouse speed and leave the carrier out entirely, which is useful when slow shipping would otherwise hide real progress.
A warehouse ships 400 orders in a week, totaling 1,200 hours order-to-ship: 1,200 ÷ 400 = 3.0 hours per order.
After fixing shelf layout and adding barcode checks, the same 400 orders take 800 hours: 800 ÷ 400 = 2.0 hours per order.
That’s a 33% improvement, one a broader metric including carrier transit might have buried completely.
Manufacturers often reach for the SCOR model, a widely used supply chain standard:
| Order Fulfillment Cycle Time = Source Cycle Time + Make Cycle Time + Deliver Cycle Time |
Sourcing at 2 days, making at 4.5 days, delivery at 1.5 days adds up to 8 days total. One catch: some stages run in parallel, not sequentially, so a straight-line sum can overstate the real total.
Where SCOR zooms into the stages inside one order, APQC (the American Productivity & Quality Center) treats customer order cycle time as one end-to-end number and benchmarks it across thousands of companies. Their cross-industry median sits at 12 days, based on data from nearly 11,874 companies. Manufacturers often use both together: SCOR to find the slow stage, APQC to see how the total compares to peers.
| Version | Usually includes | Usually excludes |
| Customer order cycle time | Order placement to delivery | Nothing, unless stated |
| SCOR order fulfillment cycle time | Source, make, and deliver stages | Pre-order sales and quoting |
| Warehouse cycle time | Order receipt through pick, pack, and ship | Carrier transit |
| Retail cycle time | Stocking, shelf fill, checkout | Upstream supplier stages |
The warehouse version is handy when shipping delays would otherwise mask your team’s actual progress.
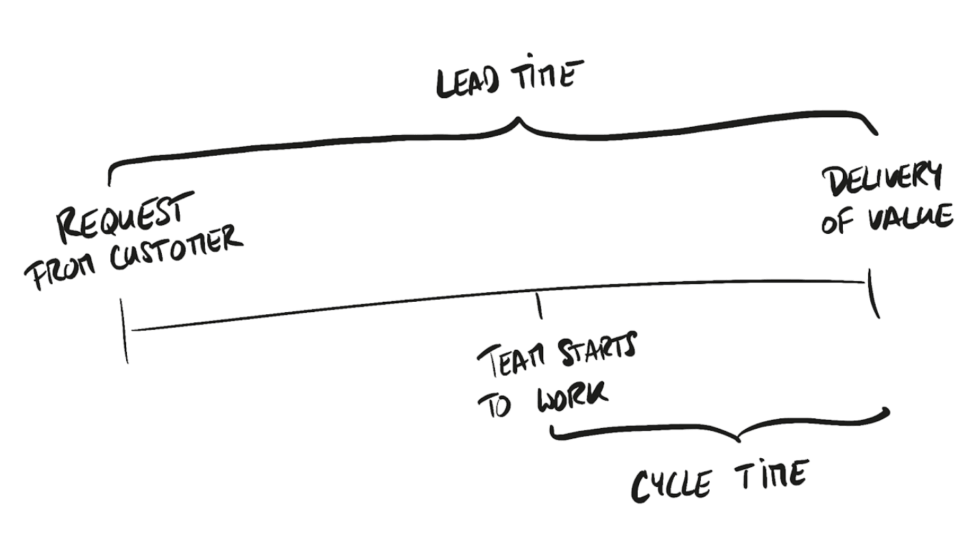
These two get treated as synonyms constantly, but they’re not interchangeable. Order cycle time is the execution clock. Lead time is the bigger umbrella covering all the waiting around it.
Order cycle time measures how fast you fulfill an order. Lead time measures the total wait a customer experiences, often starting earlier and ending later, since it can include planning and supplier delays that never touch the fulfillment clock.
For manufacturers, in a make-to-order setup, response time can nearly equal manufacturing lead time. In make-to-stock systems, inventory buffers pull the two numbers apart.
Example: fulfillment takes 8 days, but sales needs 2 more days to quote and approve before that clock even starts. The customer’s real lead time is 10 days, even though fulfillment only measured 8. That gap is exactly why the two terms confuse so many teams.
| Point | Order Cycle Time | Lead Time |
| Main job | Measures fulfillment speed | Measures total wait |
| Typical start | Order placed or received | Need identified or order released |
| Typical end | Ship, deliver, or accept | Receipt or process complete |
| Best owner | Fulfillment and logistics | Planning and procurement |
| Best use | SLAs and delivery promises | Capacity and supplier planning |
Match the metric to the question you’re asking. “How fast do we fulfill orders?” needs order cycle time. “How long does the whole process take?” needs lead time. Mixing them up is what turns reports messy.
Every order moves through a handful of stages, each adding time to the total.
Track each stage separately rather than one blended average. The bottleneck usually points right at itself once you break it down.
Public data is limited, so treat these as practical ranges, not rules. APQC’s cross-industry median is 12 days across nearly 11,874 companies, but companies with strong omnichannel support average just 6 days.
Never publish a single “industry average” as universal. Product type, stock position, geography, and shipping choices swing the number too much for that. A custom sofa and a phone case don’t belong in the same benchmark.
Automate order capture. An order management system (OMS) checks orders, allocates stock, and sets delivery dates on its own. Orders stop sitting in a queue waiting for someone to check them by hand.

Speed up the warehouse. This is usually where the biggest gains hide. Put fast-moving items near the packing station. Group orders into batches or zones. A warehouse management system (WMS) can guide workers along the shortest path instead of having them walk back and forth. Robots and goods-to-person systems can cut travel time even more. Travel time eats up more of a pick than most people realize.
Fix inventory accuracy. Barcode scanning or RFID keeps your stock counts correct. But don’t just add a quality check at the end. Build accuracy into the process itself. A check tacked on at the finish line tends to become its own bottleneck.
Sync sourcing and production. For made-to-order goods, supplier and production delays are usually what slows things down. Get better visibility into your supplier’s order status. Tighten your production schedule. Together, these lower both Source Cycle Time and Make Cycle Time.
Orchestrate transport. A transport management system (TMS) helps you pick the right carrier and build smarter shipping loads. Better routing helps you hit your ship windows instead of scrambling at the last minute.
Distribute inventory closer to customers. Most merchants skip this lever entirely. If every order ships from one warehouse, customers far away always wait longer, no matter how fast your picking is. Splitting inventory across a few fulfillment centers, or using a 3PL with regional warehouses, shortens that distance. It doesn’t even touch your internal processing speed.
You don’t need to build your own warehouse network to do this. Many merchants start with a fulfillment partner that has multiple locations. Each order routes to whichever location is closest to the customer. Yes, this adds complexity, since you now track stock in more than one place. But for merchants shipping nationwide, faster delivery usually wins.
Measure every week. None of these fixes stick without tracking. Check stage-level timestamps often, ideally every week. Find whichever stage is piling up the most time, and fix that one first. You can’t fix a delay you never noticed.
Your order ships on time. Your warehouse hits every target. And yet the support inbox still fills up with “Where is my order?” That’s the frustrating part: fast fulfillment doesn’t mean much to a customer who can’t see it happening.
Without a clear tracking experience, shoppers are left guessing. They open five different carrier sites, none of which match your branding, hoping for an update that isn’t there. When nothing shows up, they email your support team instead, and now your staff is doing the same carrier-hopping just to answer one question. Multiply that by hundreds of orders a week, and WISMO tickets quietly eat into the time your team could spend on actual problems, not status checks. Worse, a customer who feels left in the dark once is a customer who’s less likely to order from you again.
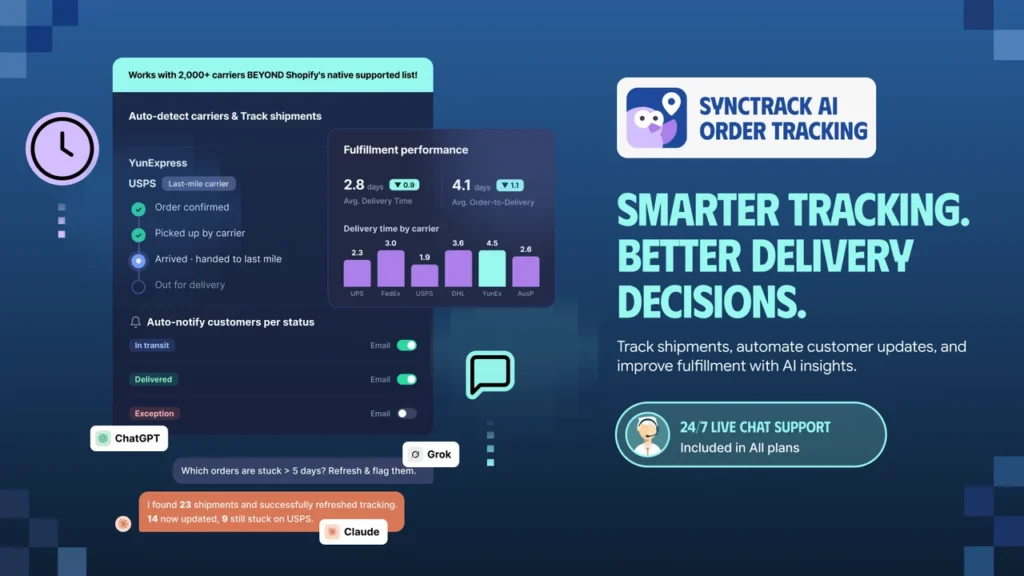
Synctrack Order Tracking closes that blind spot with a branded tracking page built into your store’s look and feel. Instead of sending customers to a generic carrier site, you give them one place to search their order, check shipment status, and see a clear estimated delivery date, so they know what to expect without needing to ask you.
Behind that page, real-time tracking keeps every update current the moment the carrier reports it, and auto-matched couriers mean orders get linked to the right carrier automatically, no manual entry, no mismatched tracking numbers. Customers get email notifications the instant their status changes, which means they hear it from you first, not from a support ticket they had to open themselves.
For your team, AI fulfillment analytics turns raw tracking data into something you can act on. You see order status across every tracker in one dashboard, spot which shipments are running behind before the customer notices, and catch patterns, like a specific carrier or region consistently underperforming, early enough to fix them.
And Synctrack goes beyond Shopify Flow. It also works directly with Shopify Sidekick, letting merchants check shipment statuses, find delayed orders, and look up tracking details using natural-language commands inside Shopify Admin. Through Shopify Flow, tracking updates can also trigger workflows across tools like Klaviyo, Gorgias, and Slack – from tagging delayed orders and alerting support teams to sending automated customer follow-ups.
The outcome is simple. Fewer WISMO tickets landing in your inbox, fewer refund and chargeback disputes tied to delivery confusion, and a post-purchase experience that makes customers want to order again. Your fulfillment was already fast. Now your customers can actually see it.
Shopify already timestamps nearly every order, from placement through fulfillment to delivery, as long as your carrier reports updates back. Collecting the data was never the hard part. Pulling it into one place to see the full picture is.
Shopify’s built-in reports handle order-to-fulfillment speed fine, but carrier transit time, the part customers care about most, usually lives outside your admin unless you connect a tracking tool. You can see how fast your team packs an order. What’s harder to see is how long it really took to reach the customer, or whether one carrier runs slower than another, without logging into several carrier dashboards by hand.
This is where a tracking app like Synctrack Order Tracking becomes useful. It pulls carrier updates into one dashboard, so delivery times sit right next to processing times, and you can spot exactly which stage is dragging your average down.
Cutting cycle time doesn’t stop once an order leaves the warehouse. Carrier transit and final delivery can still introduce delays that shape how the whole experience feels, and customers often have no idea where their package actually is.
That gap creates a familiar headache: customers send “Where is my order?” (WISMO) messages while your support team manually checks tracking across different carriers, with limited visibility into which shipments are running late or whether promised delivery dates hold up.
A branded tracking experience closes that gap. Synctrack Order Tracking gives customers one place to look up orders, see real-time updates, and check estimated delivery dates, with AI fulfillment analytics for merchants to monitor performance and catch issues without checking every shipment by hand. It also offers:
Faster picking and shipping only move the needle if customers also get clear updates on where their package is. Pair fulfillment speed with visibility, and WISMO tickets drop while delivery problems get caught earlier.
Each team found the actual bottleneck and used technology to remove it. Staples Canada moved its quality check closer to the pick, improving speed and accuracy at once.
No. Delivery time is just the carrier transit stage. Order cycle time covers the whole journey: placement, processing, shipping, and delivery.
Most teams count calendar days for the customer-facing number, since that’s what customers live through while they wait. Internal, warehouse-only metrics sometimes switch to business days instead. Either way works, as long as you state which one you’re using.
Weekly is a solid default. It’s frequent enough to catch a slipping carrier or a warehouse slowdown before it turns into a pattern.
Up to a point, yes. Warehouse layout, promise-date rules, and earlier supplier syncing all help without spending anything on new tools. Visibility into carrier transit is the exception. That data lives outside your own systems, so it usually takes a tracking tool to see it.
Reducing order cycle time isn’t about making every step faster at any cost. It’s about finding where orders sit and wait, then removing the delays that matter most. Define your measurement clearly, track each stage, and go after the biggest bottleneck first. Once your data is consistent, the improvements become easy to measure, and your customers get faster, more predictable service.