Q3 2026 was a breakthrough quarter for Synctrack Returns & Exchanges. For the first time, our merchants kept more than $1 million in revenue in their stores in a single quarter, money that would otherwise have gone back to shoppers as cash refunds.
Our mission is the same as ever: turn returns from a cost into a source of kept revenue and customer loyalty. This quarter’s numbers show that more merchants are making that shift.
Here is our Q3 2026 Performance Report.
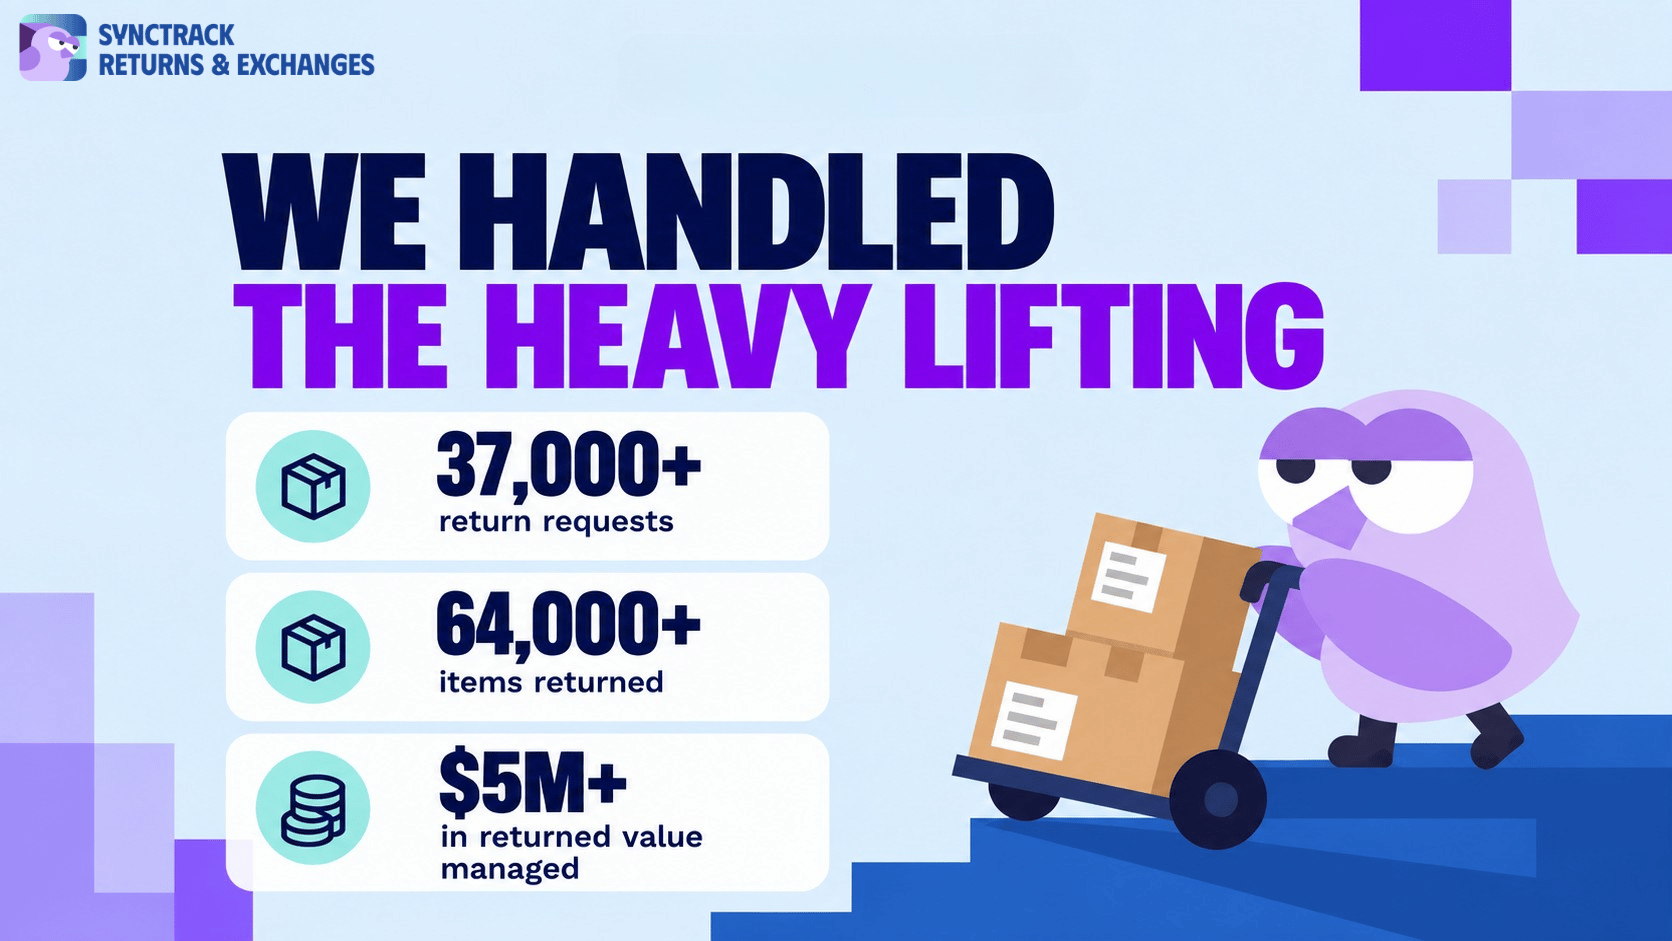
Between July and September, Synctrack handled our biggest volume of the year so far:
Request volume grew by about 16% over Q2. At the same time, the average order return rate fell from about 1.6% in Q2 to about 1.1% in Q3, the lowest of the year. More stores are using Synctrack, and fewer orders are coming back. That suggests clearer return policies, better product information and smarter portal rules are helping shoppers get it right the first time.
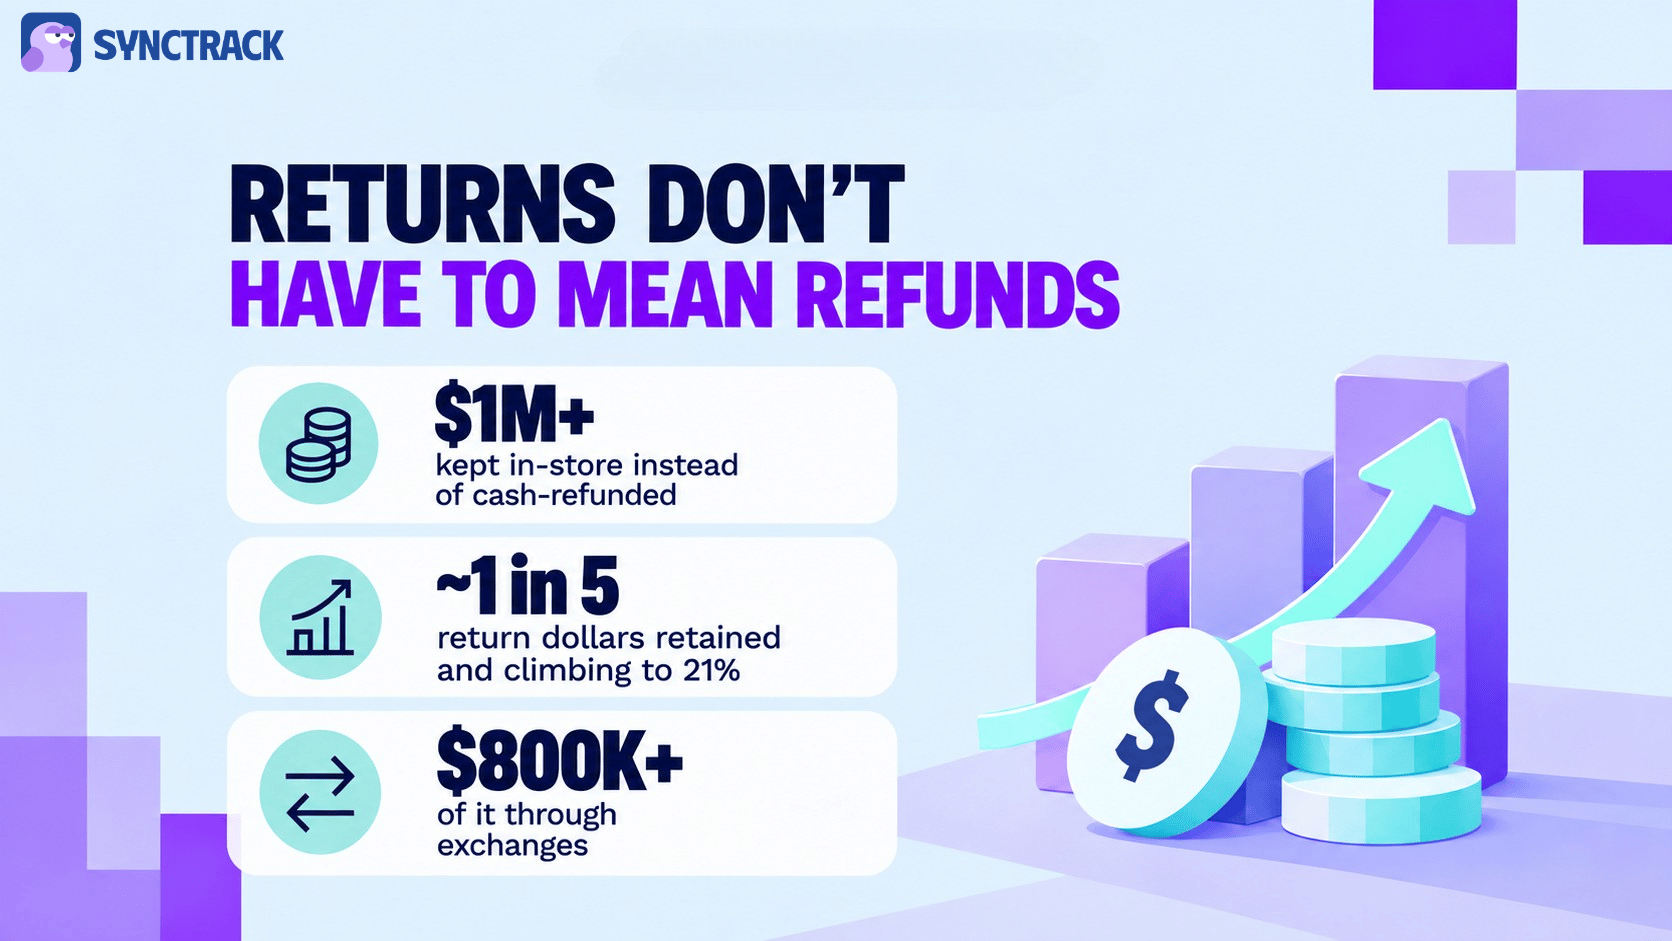
The most important metric for any merchant is Retained Revenue: the money that stays in your store instead of going out as a cash refund.
In Q3, Synctrack merchants kept more than $1 million. Our Retained Revenue Ratio reached about 20%, so for every $100 of return value processed, $20 stayed in-store.
That ratio has climbed every quarter this year:
| Quarter | Retained Revenue Ratio |
|---|---|
| Q1 2026 | ~15% |
| Q2 2026 | ~17% |
| Q3 2026 | ~20% |
Total return value was slightly lower than in Q2 2026, yet retained revenue still grew by more than $100K. Merchants are getting better at turning each return into a result other than a refund.
| Resolution Type | Revenue Retained | Strategic Value |
|---|---|---|
| Exchanges | $840K+ | Keeps shoppers who still want the product loyal to the brand. |
| Store Credit | $270K+ | Keeps money in the store for the shopper’s next purchase. |
| Gift Cards | $135K+ | Secures future purchases and raises lifetime value. |
| Discount Codes | $5K+ | Encourages an immediate repeat purchase. |
The standout this quarter was store credit. It grew more than 4x compared with Q2, as more merchants made it a default resolution in their return portals.
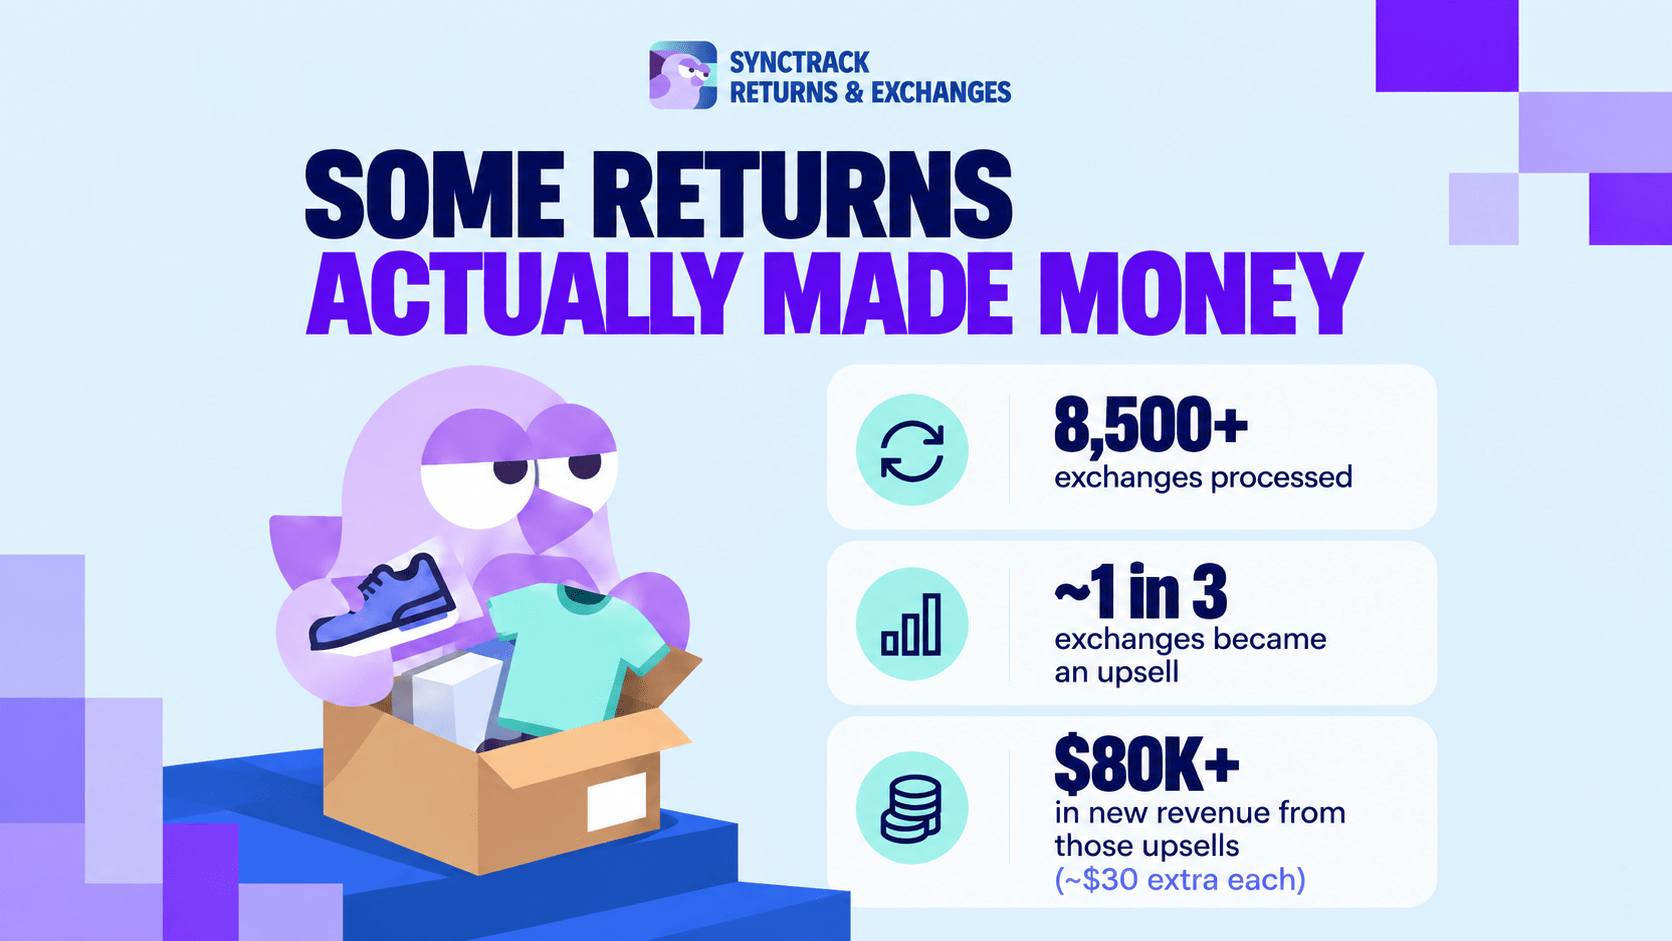
Exchanges don’t just keep revenue. Sometimes they add to it. In Q3:
With the right exchange setup, a return becomes a second sale.
Keeping revenue matters, and so does handling returns with confidence. In Q3:
Evidence and tracking help merchants approve legitimate returns faster, push back on questionable ones and know where every package is.
More than 80% of Q3 retained revenue came from exchanges, and 1 in 3 became an upsell. If your portal doesn’t make “exchange for a different size or product” the easiest option, you are losing both kept revenue and new revenue.
Store credit grew more than 4x quarter over quarter. When the process is simple, shoppers are happy to accept credit instead of cash, and that money stays in your store.
Nearly 80% of returns were requested within 14 days of the order, and more than 95% within 30 days. The first two weeks after purchase are when your return experience matters most.
Handling 37,000+ requests by hand would overwhelm any support team. Saving 600+ hours in one quarter gives teams time back for the customers who need a person.
Q4 brings Black Friday, Cyber Monday and the holidays, the busiest season for both sales and returns. With our Retained Revenue Ratio now at 20%, our goal is to help merchants push it even higher through:
To our merchants: thank you for trusting Synctrack with your post-purchase experience. Let’s finish 2026 strong.